

Combining data sources.
Analysis
After collecting and structuring all the data, we analysed the content of the tweets & reviews with machine learning tools in order to get a deeper understanding of the content of the customer feedback. First we analysed the sentiment of a tweet and afterwards we configured the software to identify key topics related to the content of the tweet. E.g. Design & UX and Connectivity. We also analysed the quantitative points like the review scores and their distribution over time.
We found several key topics related to specific issues with the app and could create a clear overview of the current performance of the app.

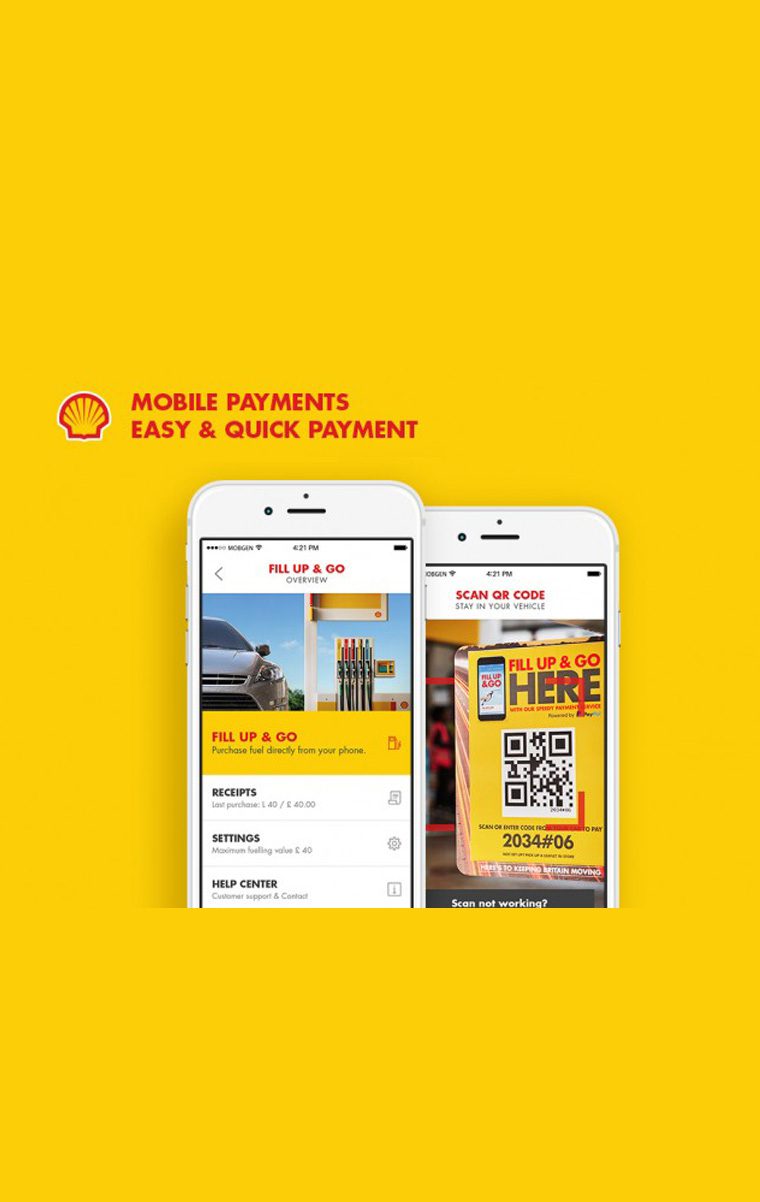
Fill up and Go.
Dashboard metrics
Two main goals for Shell’s Motorist App are: creating stronger brand awareness and increasing fuel revenues. Before we can say anything about the level of customer satisfaction for the ‘Fill up and Go’ feature, we first need to clarify the KPIs and metrics. Examples are:
– Emotional Visualizer
– Sentiment distribution/analysis of the reviews and their topics
– Comparing the reviews/performance between countries
– Value per customer
– Usage time of the app
– Transaction and registration funnel


Understanding the data.
Example data insights
1. Bugs and problems (16.8% reviews). Notably, 89% of these reviews are negative.
– Login Problems (5.5%)
– Payment problems (3.3%)
– Accuracy of the information (4.7%)
2. Connectivity (5%) These reviews are connectivity & location related. E.g. “Good app, only works when you have a good signal”.
3. 11.9% of the reviews are mainly positive and often include feature request. E.g: offer more contextual offers.